
Page 12 - Newcom
P. 12
12 | INVESTMENT EXECUTIVE
ETF demand
keeps rising
FOCUS ON PRODUCTS Mid-November 2020
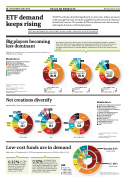
The ETF market has diversified significantly in recent years. Inflows and assets under management have increased, propelled by interest from both retail and institutional investors. The number of ETF manufacturers also has increased, reducing the dominance of the largest players
TEXT AND RESEARCH BY GUILLAUME POULIN-GOYER | DESIGN BY SYLVIE THAUVETTE
Big players becoming less dominant
Manufacturer market share as measured by assets traded on a Canadian stock exchange
The markets have an increasing effect on assets under management (AUM) for Canadian ETFs. From 2015 to 2017, the markets were responsible for about 20%–30% of the annual increase or decrease in AUM, with the rest attributable to net sales, according to the Investment Funds Institute of Canada. Markets contributed to 42.3% of the change in AUM in 2019.
0.9%
Manufacturers
n BlackRock Asset Management Canada Ltd. n BMO Global Asset Management
n Vanguard Investments Canada Ltd.
n Horizons ETFs Management (Canada) Inc. n Invesco Canada Ltd.
n First Asset (CI Investments in 2020) n RBC Global Asset Management
n Purpose Investments Inc.
n Mackenzie Investments
n Other
Figures may not add up to 100% due to rounding.
Sources: Canadian ETF Association; Investor Economics Inc.
*approximately; market share as a % of all investment funds
Manufacturers ETFs
ETFs’ market share
16 420 7.8%*
Manufacturers 28 ETFs 612 ETFs’ market share 9.4%*
Manufacturers 38 ETFs 808 ETFs’ market share 12.0%*
Manufacturers
n BlackRock Asset Management Canada Ltd. n BMO Global Asset Management
n Vanguard Investments Canada Ltd.
n Horizons ETFs Management (Canada) Inc. n Invesco Canada Ltd.
n First Asset (CI Investments in 2020) n RBC Global Asset Management
n Purpose Investments Inc.
n Mackenzie Investments
n PIMCO Canada Corp.
n Franklin Templeton Investments Corp. n National Bank Financial Inc.
n TD Asset Management Inc.
n Other
Figures may not add up to 100% due to rounding.
Sources: Canadian ETF Association; Investor Economics Inc.
1.8%
0.0%+
1.9%
2.9%
0.5%
3.1%
7.2%
2.8%
5.4%
8.2%
49.2%
4.0%
1.1%
Assets under mgmt. ($bil.)
AS OF JUNE 30, 2016
2.2%
37.7%
6.4% Assets under
102.98
29.2%
10.5%
31.2%
mgmt. ($bil.)
156.96
AS OF JUNE 30, 2018
1.8%
1.4%
1.9%
4.4%
Assets under 6.2% mgmt. ($bil.)
217.77
12.2%
29.6%
AS OF JUNE 30, 2020
32.3%
Net creations diversify
Canadian ETF positive net creations by issuer (as a % of net industry creations)
3.8%
4.3%
0.7%
3.3%
1.4%
6.3% 9.9% 4.9 %
5.1%
7.6%
15.9%
2016 TO 2018
13.4%
8.7%
7.9% Net creations
7.8% 33.0 4.2%
14.0%
Net creations ($bil.)
5.2%
11.7%
Net creations ($bil.)
33.6%
($bil.)
2.9%
3.4%
7.4%
18.3%
2.8%
63.1
38.3%
29.4
21.7%
2.3%
Low-cost funds are in demand
JAN. TO SEPT. 2020
9.8%
14.0%
12.3%
29.0%
Canadian ETFs
(exterior circle)
U.S. ETFs
(interior circle)
17.3%
2019
9.3%
Market share of Canadian and U.S. ETFs by management expense ratio (MER) as of May 31, 2020
MER
n 0% to 0.10%
n 0.11% to 0.30% n 0.31% to 0.50% n 0.51% to 0.70% n 0.71% and higher
29.8%
51.2%
31.7%
2.6%
0.12% As of May 31, 2020, the asset-weighted
average management expense ratio for the 20 largest Canadian ETFs by assets under management (AUM) was 0.12%. This cohort represented $74.1 billion in AUM, or 35% of the overall Canadian ETF market as of that date.
0.2%
1.4%
1.7%
3.2%
3.0%
0.4%
0.9%
4.9%
0.32% As of May 31, 2020,
the asset-weighted average management expense ratio for all Canadian ETFs was 0.32%, compared with 0.19% for all U.S. ETFs.
14.7%
Source: National Bank Financial Inc., as analyzed by Finance et Investissement
