
Page 31 - Newcom
P. 31
INVESTMENT EXECUTIVE DEALERS’ REPORT CARD
June 2020
Cushioning the blow
productivity (more than two- thirds of our data’s “top perform- ers” were surveyed in February). So, it wouldn’t be accurate to view this data as “before” and “after” Covid-19 snapshots.
Yet, the data from the later surveys provide insight into the likely effects of the exceptional market volatility that emerged in March — between Feb. 20 and March 23, the S&P/TSX compos- ite index was down almost 40% — on advisors’ businesses.
Alongside the stark differ- ences in average asset readings between the early and later parts of the survey, reported advisor productivity numbers also were poles apart. Data from February alone pointed to average AUM per client household of well over $500,000. Meanwhile, the data collected in March and April showed average productivity at slightly more than $277,000 — which would represent a decline from the average reported in 2019 (again, these populations aren’t directly comparable).
Market turmoil also has affected the distribution of client accounts. Overall Report
Card results indicate that dealer advisors steadily increased their share of larger accounts.
Accounts worth less than $100,000 remained the single largest component of the average book, with a 23.8% share, but this was down a bit from 24.7% in last year’s Report Card. In fact, mar- ket shares for every account cat- egory under the $500,000 mark declined year-over-year, and shares for accounts in excess of $500,000 rose.
The combined share of the average book composed of accounts greater than $500,000 rose to 34.7% this year from 29.4% in 2019. And the share for accounts of at least $1 million surged to 15.1% this year from 12.0% last year.
However, the picture is much different for data collected in February vs March and April. In February, advisors reported that 40.9% of their accounts were worth at least $500,000, and 20.4% were larger than $1 million. Conversely, in March and April, advisors reported that just 27.8% of their book was devoted to accounts above the $500,000 mark, and just 9.3% to $1 million-plus accounts.
Putting aside the differences between the pre- and mid-pan- demic segments of our sample, the overall trend in this year’s data is growth. That’s evident both in the headline numbers and when dividing the overall advisor population into the top 20% (as measured by AUM per client household) and the other 80% of the industry.
Both the industry’s top per- formers and the rest of the business enjoyed higher aver- age assets, client numbers and productivity. For the top 20%, assets were up to $134.6 million from $101.5 million in last year’s
survey. This strong growth also helped push average productiv- ity for the industry’s top perform- ers past the $1-million mark.
For the rest of the industry, asset growth was just as robust, albeit from a much lower start- ing point. Among the other 80% of advisors, average AUM rose to $50.4 million in this year’s Report Card, from $34.3 million last year.
Client rosters expanded sig- nificantly for the other 80% of advisors, with the average book size increasing to 237 households this year from 221 last year. But, even with the growth in client numbers, the average advisor in this segment managed strong productivity growth. Average AUM per client household among the other 80% rose to more than $217,000 this year from slightly more than $160,000 in 2019.
The account distribution data also demonstrate the underlying industry growth trends. For the top performers, accounts worth more than $1 million gained share of the average advisor’s book; for the rest of the industry, the inflection point was down at the $500,000 level.
Among the top 20% of advis- ors, the share of book devoted to accounts worth at least $1 mil- lion jumped to 38.3% this year from 28.9% in last year’s Report Card. There was a particularly large jump in the $1-million to $2-million category, which saw its share of the average top per- former’s book rise to 21.6% this year from 13.8% last year.
The rest of the industry also enjoyed growth in its share of larger accounts, even as sub- $100,000 accounts remained their single largest allocation, at 28.3%. At the higher end of the account distribution scale, this segment of the advisor popula- tion also gained share.
In last year’s Report Card, accounts worth more than $500,000 for the remaining 80% group made up 22.0%. This year, the share for these bigger accounts was up to 26.6%.
Alongside this overall trend to higher assets, a greater pro- portion of high net-worth cli- ents and superior productivity, advisors’ compensation was on the rise. The proportion of advisors in the overall Report Card who reported earning less than $100,000 declined to 14.3% this year from 19.9% last year.
At the same time, the share of advisors who reported earning between $250,000 and $500,000 rose to 28.6% this year from 25.8% last year; and the propor- tion earning between $500,000 and $1 million rose to 18.4% this year from 15.9% last year. The share of advisors earning more than $1 million also edged upward, to 7.0% in 2020 from 6.4% in 2019.
This general trend toward higher compensation reflects the growth advisors were gener- ating in their books over the past year, and indicates they at least entered this crisis from a pos- ition of strength. The economic fallout from the Covid-19 out- break will affect advisors’ bot- tom lines, but the robust growth trends that were evident head- ing into the crisis should cush- ion the blow. IE
Advisors experienced robust growth in AUM, client numbers and productivity before the pandemic
February — when the Covid- 19 outbreak had been detected but hadn’t yet turned into a full-blown pandemic — was about double the average assets reported in March and April.
Looking solely at data from February (about 40% of the sample), average AUM reported in the early days of our research was $99.0 million. Conversely, data collected in March and April showed average assets of just $48.9 million — less than half the February reading, and in line with the level reported in last year’s Report Card.
The two sample populations — those surveyed in February and those surveyed in March and April — aren’t directly equivalent. The advisors sur- veyed in February have been in the industry and with their cur- rent firms longer than the advis- ors surveyed in March and April, and both factors are associated with higher assets and greater
n BY JAMES LANGTON looking only at the head-
line data for this year’s edition of Investment Executive’s Dealers’ Report Card, the industry appeared to enjoy stellar growth in many of its fundamental metrics — at least until markets were roiled by Covid-19. Based on data collected from February 18 to April 3, 2020, assets under management (AUM) were up dramatically from last year’s research period: average AUM surged to $70.1 million from $48.6 million last year.
This increase in average assets was accompanied by a modest rise in client numbers. The aver- age dealer advisor served 222 households, up from 208 in last year’s Report Card. This expan- sion likely provided some of the boost in AUM, but given that assets grew at a far faster rate, market gains probably did much of the heavy lifting.
As assets grew sharply over the past year, advisor
productivity (as measured by AUM per client household) also grew. Average productivity climbed to slightly more than $380,000 this year from slightly less than $323,000 last year. (While Montreal-based Peak Financial Group and Markham, Ont.-based Worldsource Wealth Management Inc. have not been assigned performance ratings due to insufficient sample sizes, demographic data from those firms has been used.)
This year’s results come with a huge caveat — the global pan- demic that emerged in the midst of this year’s survey, causing widespread economic damage and prompting a precipitous drop in global equity markets. So, while the average advisor in the survey reported strong growth, the facts on the ground have changed significantly in the weeks since the research began.
In fact, the average AUM reported in data collected in
The proportion of advisors who reported earning less than $100,000 declined to 14.3% this year from 19.9% last year
31
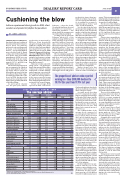
2020 DEALERS’ REPORT CARD The average advisor
OVERALL
TOP 20%
REMAINING 80%
2020
2019
2020
2019
2020
2019
Average
Age
52.8
53.1
52.6
54.4
52.5
52.7
Years with firm
12.2
11.2
14.9
13.7
11.6
10.7
Years in industry
23.1
21.8
24.5
25.3
22.7
21.0
Size of book ($mil.)
70.1
48.6
134.6
101.5
50.4
34.3
Number of client households
222
208
170
166
237
221
AUM per client household
$380,188
$322,859
$1,032,638
$969,314
$217,076
$160,362
% of client accounts with assets* of:
Less than $100,000
23.8
24.7
6.3
8.8
28.3
28.8
$100,000 to $250,000
20.0
23.4
11.5
13.5
22.3
26.2
$250,000 to $500,000
21.6
22.8
17.5
22.4
22.8
23.0
$500,000 to $1 million
19.6
17.4
26.4
26.5
17.9
15.0
$1 million to $2 million
9.7
7.1
21.6
13.8
6.3
5.0
More than $2 million
5.4
4.9
16.7
15.1
2.4
2.0
Average % of source of revenue*:
Fee/asset-based
78.2
71.8
87.6
78.7
77.1
70.7
Transaction-based
19.3
24.9
11.0
18.2
20.5
25.9
Fee for service
1.8
1.8
1.3
1.7
1.7
1.8
Deal-based
0.0
0.2
0.0
0.0
0.0
0.3
Branch manager override
0.7
1.4
0.0
1.6
0.7
1.5
Average % of product distribution*:
Equities
3.0
3.5
7.4
9.8
2.0
1.7
Bonds
1.1
0.5
1.8
1.4
1.0
0.2
Mutual funds
74.7
67.4
69.1
54.4
75.4
70.7
ETFs
3.0
1.9
3.8
4.0
2.9
1.1
Proprietary managed
1.3
4.4
5.0
10.0
0.4
2.7
Third-party managed
2.3
3.7
4.4
7.5
1.8
2.9
Alternative investments
0.4
0.3
0.3
0.2
0.5
0.3
Income trusts
0.0
0.1
0.2
0.3
0.0
0.0
Insurance products
12.8
16.7
7.7
11.5
14.4
18.3
Banking products
1.4
1.9
0.4
1.7
1.6
2.0
*Numbers do not always total 100% because of rounding
Includes demographic data from Peak Financial Group and Worldsource Wealth Management Inc. Source: Investment Executive research
IE
