
Page 30 - Newcom
P. 30
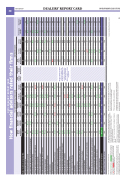
June 2020 DEALERS’ REPORT CARD INVESTMENT EXECUTIVE 30
Number of advisors surveyed per firm
50
40 50
40 50
51
29 41
37
Firm's total compensation
Firm's reward/recognition program
Firm's support for advisors operating within a fee-based model Technology tools & advisor desktop
Support for mobile technology & the mobile advisor
Support for using social media
Back office & administrative support
Firm's marketing support for advisor's practice
Client account statements
Online account access for clients
Ongoing training
Your branch manager
Firm's succession program for advisors
Products & support for high net-worth clients
Support for developing a financial plan for clients
Support for developing an investment plan for clients** Support for wills and estate planning
Support for tax planning
Support for insurance planning
Quality of firm's product offering
Firm's stability
Firm's strategic focus
Firm's effectiveness in keeping advisors informed
Firm's receptiveness to advisor feedback
Firm's corporate culture
Firm's reputation with clients and/or prospective clients
Firm's ethics
Support for dealing with changes in the regulatory environment Advisor's relationship with compliance department
Freedom to make objective product choices
Firm's delivery on promises
IE Rating (Average of all categories)
Net Promoter Score (range: -100 to 100)
8.7
7.9 8.3 6.5 N/A 6.7 7.8
8.6 8.0 N/C 7.2
8.5 7.0 7.7 6.8 6.0 7.1 7.6 5.7 6.4 5.0 7.5 8.2 8.2 7.2 8.1
8.7 9.0 8.2 N/A 8.4 8.0 9.3 7.3
8.9 8.5 9.0 N/A 7.5 6.3
All ratings are based on a scale of 0 to 10.
The “importance average” tallies all the importance ratings in a given category and averages them together. It is intended to measure how important advisors think a Report Card category is to their business.
N/A means a category does not apply to a company; N/C means the category is not calculable because not enough advisors rated it to be a reasonable sample.
Source: Investment Executive research
Numbers in GREEN or in a GREEN BOX indicate a rating has increased by at least 0.5 of a point from last year. Numbers in RED or in a RED BOX indicate a rating has decreased by at least 0.5 of a point from last year.
The “IE rating” is an average of all of a company’s category ratings.
*Firm has both an IIROC and an MFDA arm
The “performance average” tallies all the ratings in a given category and averages them together. You can check to see if a company is above or below the average.
The Net Promoter Score ranges from -100 to 100. A score over 0 is considered good, over 50 is considered excellent and over 70 is considered exceptional.
**Companies were only rated in this category if most advis- ors indicated that investment planning was separate from financial planning
IE
Assante Desjardins Investia Investment
Wealth Financial Financial Planning IG Wealth
Peak Financial
Worldsource Wealth
Carte
Wealth Portfolio Sterling Performance Importance
8.3 8.6 8.2 8.4 7.7 8.3 8.7 8.4 8.7 8.3 9.2 8.7 9.0 8.9 8.7 9.2 9.0 9.0 9.2 9.5 9.2 9.1 9.0 9.1 9.1 9.6 9.4 9.4 9.8 8.7 8.9 86.0
8.2 7.8 7.3 8.3 7.9 8.7 7.7 8.1 8.1 8.5 7.2 8.0 6.7
7.8 7.5 6.8 7.5 7.0 8.1 6.9 8.1 8.0 7.9 8.7 8.0 9.2
8.9
8.0 8.6 8.0 9.3 7.8 8.7 7.3 7.0
7.4 8.1 7.1 8.4
8.8 N/A 9.0 5.5 8.9 8.3 8.7 N/A 8.7 7.6 9.1 8.3 8.6 7.4
9.5 9.3 N/A 9.1 N/A 8.6 9.4 7.5 9.4 N/A N/A N/A N/A N/A N/A N/A 9.2 9.1 8.6 8.2 8.1 8.8 7.7 9.4 9.1 9.2 9.6 8.6 8.9 75.0
6.0 N/C 6.9 7.5 6.2 5.5 7.3 7.6 7.1 8.2
7.9 9.5
6.3 6.4 7.9 8.4
8.7 9.2 N/A N/A 8.4 N/A N/C N/A
7.4 8.2 7.7 9.0 8.0 8.9 7.6 8.4 8.6 9.0 8.0 9.0 8.0 8.9 7.9 9.2
N/C 7.2 7.2 N/C 6.8 N/C N/C 7.0 N/A N/C N/A 8.2 N/C 8.1 8.5 8.6 8.9
6.3
8.1 8.4 7.9 8.0 8.5 8.5 8.5 7.6 7.7 7.2 9.4 9.1 8.8
N/A N/A 8.1 8.7 8.3 7.3 8.0 6.6 8.0 8.6 9.0 8.6 8.7 9.6 8.2 7.7 39.2
We were unable to obtain sufficient sample sizes for these companies. For executive commentary from these firms and advisor insight, see story on page 33.
N/A N/A N/A N/A N/A N/C N/A 9.1 9.4
7.6 8.7
7.1 7.8 7.1 8.0 6.8 7.4 7.3 7.7 7.6 7.2
7.9 8.5 9.6 8.9 8.9 8.6 9.1 8.6 9.4 9.1 8.9
8.9 8.8 8.9 8.0 9.1 7.9 8.9 7.9 9.2 8.1
8.2 8.9 8.8 9.4 8.9 9.4 8.3 9.0 8.3 9.0 7.9 9.2 8.3 8.8 7.9 9.0 9.3 9.8
8.6 9.0 8.1 8.2 8.2 8.6 9.3 9.5 7.2 7.6 7.4 7.9 25.0 36.0
9.3 7.4
9.6 9.5 9.8 8.9 9.3 9.0 9.8 9.7 9.0 9.0 8.9 8.3 75.9 75.6
8.9 9.4 8.9 9.4 9.3 9.7 8.4 9.4
2020 DEALERS' REPORT CARD
How financial advisors rated their firms
FULL-SERVICE AND MUTUAL FUND DEALERS
INDEPENDENT DEALERS
Manulife
Management* Security* Services Counsel* Management* Securities* Group* Management* Management Strategies Mutuals average average
N/A
9.0 8.3 67.5
8.2 8.0 60.0
8.3 7.1
