
Page 2 - Newcom
P. 2
2 | INVESTMENT EXECUTIVE NEWS PROFIT SURVEY
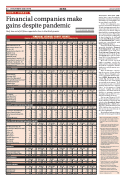
Financial companies make gains despite pandemic
January 2021
financial services com-
panies have come through the pandemic relatively unscathed, with many reporting higher net income than a year earlier.
Of the 42 companies ana- lyzed by Investment Executive, 22 had earnings gains and three reported positive net income ver- sus a loss a year earlier. Only 15 firms had lower earnings and just two reported a loss. (These fig- ures are for quarters ending Aug. 31, Sept. 30 and Oct. 31, 2020, and exclude Great West Lifeco [GWL] and IGM Financial Inc., whose results are consolidated with Power Financial Corp.’s.)
Only three firms raised their quarterly dividends. Element Fleet Management Corp. upped its dividend to 6.5¢ from 4.5¢, First National Financial Corp. raised its to 52.50¢ from 48.75¢ and Sprott Inc.’s went to US25¢ from US23¢. First National also paid a special dividend of 50¢.
Most sub-sectors reported higher earnings, except the banks and the mutual fund and investment companies, but the banks were only down an aver- age of 5.5%.
With lockdowns continu- ing, the spectre of loan defaults remains. Robert Colangelo, sen- ior vice-president with Toronto- based DBRS Morningstar Ltd., called Big Six banks’ results “solid despite the challenging operating environment” in a recent report. Loans covered by payment deferral were “sharply lower” in the quarter. Going forward, “highly diversified franchises and demonstrated abilities to manage expenses should provide an offset” to con- strained earnings, he wrote.
Net income dropped 52.9% for the mutual fund and invest- ment companies collectively, but only because Brookfield Asset Management Inc.’s (BAM)earn- ings fell to US$542 million from US$1.8 billion the year before. Net income increased for six of the other eight firms.
Most insurers had a good quar- ter while the brokerages benefited
N/A = not applicable; NA = not available because company has negative sharehold- ers’ equity; NC = not calculable because Desjardins Group does not have common shares
1 Unusual,non-recurringitemshavebeen excluded where possible. In some cases, these figures have been estimated
2 Per-share data are fully diluted except when there is a loss or negative operat- ing cash flow in either this quarter or the corresponding quarter a year earlier, in which case the number of basic shares are used in the calculation
3 Calculated as non-interest expenses excluding amortization as % of revenue (excluding insurance revenue). Unusual expenses (such as for legal settlements) and unusually high revenue items (such as writedowns or large gains or losses from financial instruments) are excluded from the calculation
4 Operating cash flow after change in non- cash working balances
5 Calculated using net income (excluding unusual, non-recurring items) for the past 12 months as % of average of be- ginning and ending shareholders’ equity
6 VersaBank’s, First National Financial Corp.’s, Firm Capital Mortgage Invest- ment Corp.’s and Timbercreek Financial Corp.’s net income includes comprehen- sive income
7 Great-West Lifeco Inc.’s and IGM Finan- cial Inc.’s results are consolidated with Power Financial Corp.’s results
8 Calculated as losses and operating expenses as % of net earned premiums
9 Brookfield’s revenues exclude the change In fair market value of assets
10 GMP has assets under administration Sources: Company reports IE
Only two out of 42 firms reported a loss in the third quarter
BY CATHERINE HARRIS
BANKS
($bil.) Bank of Montreal (Oct. 31)1 949 Bank of Nova Scotia (Oct. 31)1 1,136 CIBC (Oct. 31)1 770 Canadian Western Bank (Oct. 31)1 34 Equitable Group 30 Home Capital Group 19 HSBC Bank Canada 124 Laurentian Bank of Canada (Oct. 31)1 44 National Bank of Canada (Oct. 31)1 332 Royal Bank of Canada (Oct. 31) 1,625 Toronto-Dominion Bank (Oct. 31)1 1,716 VersaBank (Oct. 31)6 2 Subtotal 6,781
FINANCE COMPANIES
% chg. ($mil.)
11.4 6,064 4.6 7,513 18.1 4,600 8.0 237
10.5 149 1.6 137 11.3 472 -0.4 244 17.8 2,073 13.7 11,219 21.2 10,467 8.9 14 13.9 43,187
% chg.
-1.6 -5.7 -3.6
7.1 16.3 16.9 -11.6 0.8 3.2 -2.3 0.9 0.7 -1.9
0.4 1.8 15.7 0.5 38.3 2.6 1.8 Subtotal 61.1
0.33 0.01 0.20 0.26 1.00 0.60 0.17
0.07 0.02 0.18 0.21 1.20 0.92 0.18
-3.67 0.53 2.05 0.35
-6.89 -2.33 0.24
Accord Financial1
ECN Capital (US$)1
Element Fleet Management1
Firm Capital Mortgage Investment6 First National Financial6
MCAN Mortgage
Timbercreek Financial6
LIFE INSURERS
($bil.) E-L Financial 8 Great-West Lifeco1,7 578 iA Financial Group1 44 Manulife Financial 688 Sun Life Financial1 990 Subtotal 2,309
PROPERTY & CASUALTY AND MORTGAGE INSURERS
Co-operators General Insurance Echelon Financial Holdings1 Fairfax Financial Holdings (US$) Intact1
20.7 35.2 1.4 10.6 2.5 6.3
2019
103.0 115.4 97.5 92.3 37.8
Cash ($mil.) 23.8 2,227.0 140.1 -3.0 25.8 -150.6 22.4 174.9 12.1 0.4 2,472.9
2020
91.6 95.4 98.5
87.1 32.2
flow4
% chg.
10.1 17.3 9.7 N/A -43.5 N/A -1.7 -27.9 -49.9 1.2 5.5
Genworth MI Canada
Subtotal 120.7
MUTUAL FUND AND INVESTMENT MANAGEMENT COMPANIES
($bil.) AGF Management (Aug. 31) 37.0 Brookfield Asset Management (US$)9 577.5 CI Financial1 128.3 Dundee Corp. 0.1 Fiera Capital1 177.7 GMP Capital 1, 10 N/A Guardian Capital Group 32.7 IGM Financial1,7 172.6 Sprott (US$) 16.3 Stone Investment Group 550.9 Subtotal 1,693.1
BROKERAGES
CanaccordGenuityGroup1
Oppenheimer Holdings (US$)
Subtotal 666.6 STOCK EXCHANGES
% chg.
-1.1 6.0 -1.0
29.5 7.9 N/A 8.2 6.2 90.2 3.7 5.2
($mil.)
106.3 16,422.0 509.4 34.6 170.7 7.5 79.4 753.4 35.4 2.4 18,121.0
% chg. ($mil.)
-1.0 14.8 -10.5 542.0 -3.6 130.2 N/A 16.5 6.7 7.3 -28.9 -2.1 9.5 42.7 1.2 214.2 78.0 8.7 -6.5 0.5 -9.3 974.8
% chg.
2.8 -69.1 -6.2 N/A N/A N/A 376.5 5.8 100.7 N/A -52.9
TMX Group1
HOLDING COMPANIES
Desjardins Group
Power Financial1
Subtotal 820
7.5 2020
FINANCIAL SERVICES PROFIT SURVEY
FINANCIAL RESULTS FOR THE THREE MONTHS ENDED SEPT. 30, 2020, UNLESS OTHERWISE NOTED
Assets
Revenue
Net income ($mil.) % chg. 1,587 2.2 1,922 -19.0 1,016 -14.0 70 -4.8 74 34.6 58 49.9 112 -25.3 40 -12.0 563 -8.0 3,246 1.2 2,917 -2.7 5 -12.2 11,610 -5.5
Net income
EPS ($)2 2019 2020
2.34 2.38 1.77 1.44 2.56 2.20 0.77 0.73 3.18 4.30 0.67 1.12 0.28 0.18 0.99 0.93 1.69 1.56 2.18 2.23 1.62 1.57 0.23 0.20
EPS ($)2 2019 2020
Efficiency ratio (%)3 Cash 2019 2020 ($mil.) 58.5 57.2 -20,181 52.1 51.8 8,855 56.9 58.5 -2,994 48.2 52.1 85 39.5 35.7 572 53.2 44.2 -58 56.9 65.3 3 72.0 70.7 142 51.4 52.1 -27,828 58.2 55.8 -1,858 55.6 58.7 22,801 45.3 48.6 -95 56.0 56.1 -20,554
flow4
% chg.
N/A 117.8 N/A -67.6 2,936.7 N/A 382.4 N/A N/A -116.8 2,760.9 N/A N/A
ROE (%)5 2019 2020 13.6 10.2 13.9 10.1 15.1 10.7 10.9 9.1 14.7 14.3 7.6 9.9 11.7 5.4 7.4 4.9 17.1 15.6 16.6 14.1 15.5 11.1 8.9 7.9 15.0 11.5
ROE (%)5 2019 2020 11.7 N/A NA 0.1 8.6 10.5 8.3 9.0 32.6 37.0 13.1 9.5 7.7 6.7 8.1 10.4
Assets
Revenue
CF/share2 2020
($bil.)
% chg. ($mil.)
-7.0 12.3
12.2 69.5 -12.0 348.2 2.1 10.7 2.9 206.3 16.7 41.6 4.9 31.5 -0.7 720.1
% chg. ($mil.)
-19.5 0.6 9.7 8.0 -4.5 90.8 -12.5 5.9 16.2 72.5 27.5 22.7 0.8 14.4 3.3 215.1
% chg.
-75.7 68.5 -7.3 -22.8 19.7 56.3 3.8 6.4
Assets
Net income %chg. ($mil.) % chg.
CF/share2
ROE (%)5
%chg. ($mil.)
-5.3 621 8.3 13,740 -17.8 4,099 6.5 13,376 12.2 10,032 8.6 41,868
Assets
($bil.) % chg. ($mil.)
8.1 11.5 1,070
0.1 -46.3 12 71.3 2.3 4,993 34.1 13.3 3,127
8.8 -4.4 10.3
-40.9 4.3 -17.8
236 113.7 828 2.5 215 8.8 1,789 190.9 898 14.8 3,966 57.8
Net income ($mil.) % chg. 152 1,125.7 -3 N/A 42 -43.8 347 75.3 124 11.9 663 67.7
Net income
23.26 0.79 1.80 0.35 1.19
EPS 2019 0.42 -0.04 2.04 1.34 1.29
EPS 2019 0.18 0.61 0.60 -0.30 0.00 -0.13 0.31 0.85 0.17 0.00
Cash ($mil.) 182.2 -132.5 49.7
Cash ($mil.) 101.7
EPS 2019 NC 0.89
48.71 0.82 1.99 1.04 1.30
($)2 2020
5.67 -0.25 4.44 2.34 1.44
($)2 2020
0.19 0.10 0.61 0.14 0.07 0.08 1.56 0.90 0.34 0.02
flow4
% chg.
N/A N/A N/A
flow4
% chg.
5.0
($)2 2020
NC 0.72
115 4,326 410 4,960 3,155 12,966
-18.7 240.4 N/A -10.8 1,652.8 85.6
29.53 17.57 1.28 4.59 -1.61 3.81
2.86 2.68 0.18 -0.23
Cash flow4 ($mil.) % chg. 234 10.3 -3 N/A 312 -56.4 779 13.6 199 -1.4 1,522 -16.3
CF/share2 2019 2020
0.27 0.30 0.70 1.19 0.55 0.66
-0.04 -0.05 0.45 0.24 -0.57 -2.06 0.81 0.81 1.02 0.73 0.94 0.47 0.02 0.02
ROE (%)5 2019 2020
12.3 16.1 6.4 11.3 9.5 13.9
ROE (%)5 2019 2020
2019
NC 1.62
3.7 4.7 13.7 12.4 12.8 10.7 11.3 10.8 12.3 11.5
12.2 11.3
ROE (%)5 2019 2020 6.6 14.1 N/A N/A 6.5 N/A 16.4 12.6 9.9 10.9 9.8 5.7
ROE (%)5 2019 2020 5.4 5.3 14.2 N/A 37.6 34.0 N/A N/A N/A 5.4 N/A N/A 3.3 N/A 16.8 16.3 6.1 8.0 NA NA 13.1 3.1
ROE (%)5 2019 2020 7.8 8.0 12.2 10.6 9.6 9.0
($mil.)
% chg.
44.2 17.7 31.9
($mil.)
33.5 15.6 49.1
% chg.
82.1 296.0 119.9
390.4
276.3
7.1 0.7 228
Assets
5.6 9,430 Revenue
Revenue
Net income
EPS ($)2
2019 2020
0.14 0.25 0.29 1.19
EPS ($)2
2019 2020
1.09 1.25
Net income ($mil.) % chg. 729 27.9 858 -12.5 1,587 2.3
CF/share2 2019 2020 -0.60 1.44
4.40 -10.08
CF/share2 2019 2020
1.71 1.78
Cash flow4 ($mil.) % chg.
6,271 627,000.0 4,447 202.5 10,718 628.6
Revenue
Net income ($mil.) % chg. 71.4 15.7
Revenue
($mil.) 207.6
% chg. 5.8
7.9 CF/share2
Assets ($bil.) % chg.
($mil.)
4,813 14,492 19,305
% chg.
-3.5
-4.4
-4.2
360 15.1
NC 6.12
460
-1.5
Revenue
EPS ($)2
Revenue
% chg.
Combined ratio8
Cash flow4
($mil.) % chg. 2019
-31.4 N/A 0.69 130.6 N/A -0.23 943.6 2,057.8 0.07 10.2 -10.8 0.38 -412.3 N/A 4.62 -57.3 N/A 0.44 19.7 -2.0 0.23
603.1 92.2
Cash flow4
2019 2020 ($mil.) %chg. 2019 2020 2019 2020
