
Page 8 - Newcom
P. 8
8 | INVESTMENT EXECUTIVE NEWS
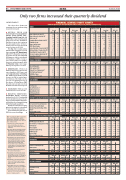
Only two firms increased their quarterly dividend
October 2020
CONTINUED FROM PAGE 7
FINANCIAL SERVICES PROFIT SURVEY
FINANCIAL RESULTS FOR THE THREE MONTHS ENDED JUNE 30, 2020, UNLESS OTHERWISE NOTED
The other three firms saw earnings drop as underwriting results deteriorated.
■■ mutual fund and investment-management firms. Fiera Capital Corp., Guardian Capital Group Ltd. and Sprott Inc. reported substantial gains in net income. Guardian’s and Sprott’s were due to gains in the fair market value of invest- ments. Fiera’s increase was from a very low base in Q2 2019.
The Big Three independent mutual fund companies reported lower earnings. AGF Management Ltd.’s 53.6% drop is due to the sale of its share in U.K.-based Smith & Williamson, which contributed $6.5 million to AGF’s revenue a year earlier. AGF’s net redemp- tions were relatively small, while CI Financial Corp.’s were large. IGM reported positive net sales.
■■ brokerages. With stock markets improving, Q2 2020 was a good quarter for Canaccord and Oppenheimer Holdings Inc. GMP Capital didn’t benefit because it sold its capital mar- kets division. The firm is in the process of acquiring the rest of the shares of Richardson GMP that it doesn’t already own from Richardson Financial Group Ltd.
■■ exchanges. TMX reported a small increase in net income.
■■ holding companies. Desjardins Group’s earnings dropped by 23.6%. Contributing factors included increased loan- loss provisions and auto insurance refunds based on changed driving habits during the pandemic.
Dundee benefited from equity gains in the quarter for its mainly resource-based investments.
Power Financial’s gain reflects GWL’s increased earnings. IE
N/A = not applicable; NA = not available because the company has negative shareholders’ equity; NC = not calcul- able because Desjardins Group does not have common shares
1 Unusual, non-recurring items have been excluded where possible. In some cases, these figures have been estimated
2 Per-share data are fully diluted except when there is a loss or negative oper- ating cash flow in either this quarter
or the corresponding quarter a year earlier, in which case the number of basic shares are used in the calculation
3 Calculated as non-interest expenses excluding amortization as % of rev- enue (excluding insurance revenue). Unusual expenses (such as for legal settlements) and unusually high revenue items (such as writedowns or large gains or losses from financial instruments) are excluded from the calculation
4 Operating cash flow after change in non-cash working balances
5 Calculated using net income (exclud- ing unusual, non-recurring items) for the past 12 months as % of average of beginning and ending shareholders’ equity
6 VersaBank’s, First National Financial Corp.’s and Timbercreek Financial Corp.’s net income includes compre- hensive income
7 Great-West Lifeco Inc.’s and IGM Fi- nancial Inc.’s results are consolidated with Power Financial Corp.’s results
8 Calculated as losses and operating ex- penses as % of net earned premiums
Sources: Company reports IE
BANKS
($bil.) Bank of Montreal (July 31) 974 Bank of Nova Scotia (July 31)1 1,170 CIBC (July 31)1 769 Canadian Western Bank (July 31)1 33 Equitable Group 30 Home Capital Group 19 HSBCBankCanada 125 Laurentian Bank of Canada (July 31)1 44 National Bank of Canada (July 31)1 322 Royal Bank of Canada (July 31) 1,683 Toronto-Dominion Bank (July 31)1 1,697 VersaBank (July 31)6 2 Subtotal 6,868
FINANCE COMPANIES
% chg. ($mil.)
16.0 7,290 9.7 7,734 19.6 4,759 7.4 226 13.6 131 3.4 132 8.2 502 -0.1 249 16.7 2,021 19.6 13,046 20.8 10,712 8.6 12 16.9 46,815
% chg.
8.2 1.0 -0.4 3.7 7.0 18.9 -7.9 1.6 5.6 11.9 1.7 -12.0 5.1
2019
2.34 1.86 3.07 0.81 3.15 0.53 0.22 1.08 1.34 2.22 1.76 0.21
2020
1.81 1.04 2.55 0.73 3.05 0.65 -0.01 0.96 1.66 2.20 1.22 0.18
($mil.)
23,767 -40,846 18,575 -239 -12 -335 7 448 5,645 28,772 60,331 15 96,127
% chg.
154.4 480.4 629.6
N/A N/A N/A N/A
326.1 67.0 817.8 1,256.1 N/A 512.3
Accord Financial1
ECN Capital (US$)1
Element Fleet Management1
First National Financial6
MCAN Mortgage
Timbercreek Financial6
Subtotal 62.2 LIFE INSURERS
($bil.) E-L Financial 8 Great-West Lifeco1,7 544 iA Financial Group1 44 Manulife Financial 673 SunLifeFinancial1 926 Subtotal 2,195
PROPERTY & CASUALTY AND MORTGAGE INSURERS
3,188 2.1
Net income ($mil.) % chg. 47.9 -39.5 0.9 N/A 426.3 -26.4 273.0 59.6 97.7 -11.2 845.7 -9.9
Net income
Co-operators General Insurance Echelon Financial Holdings1 Fairfax Financial Holdings (US$) Intact1
($mil.)
974.3 10.0 5,065.1 2,971.0 214.8 9,235.2
% chg.
10.1 19.2 -6.9 8.9
0.1
2019
2.84 -0.06 17.18 1.15 1.26
2020
1.65 0.05 15.26 1.81 1.13
($mil.)
279.3 2.9 -501.1 793.0 247.7 821.9
% chg.
121.1 -15.6 N/A 109.2 37.6 232.7
1
Genworth MI Canada
Subtotal 118.6
MUTUAL FUND AND INVESTMENT-MANAGEMENT COMPANIES
AGF Management (May 31) 36.3 Brookfield Asset Management (US$) 545.3 CI Financial1 125.6 Fiera Capital1 171.0 Guardian Capital Group 31.2 IGM Financial1,7 165.4 Sprott (US$) 13.9 Stone Investment Group 524.3 Subtotal 1,612.9 BROKERAGES
Revenue
-5.2 0.1 -3.3 14.3 3.7 1.9 71.4 -2.8 0.7
($mil.) Canaccord Genuity Group1 377.7 GMP Capital1 7.1 Oppenheimer Holdings (US$) 264.7 Subtotal 649.5
STOCK EXCHANGES
TMX Group1
HOLDING COMPANIES
Desjardins Group
Dundee
Power Financial1
Subtotal 829.5
% chg.
16.0 -19.1 5.5 11.0
2019
0.19 -0.07 0.89
2020
0.22 -0.05 1.34
($mil.)
-162.7 -47.9 225.1 14.4
% chg.
N/A N/A N/A N/A
9.6 N/A 9.4 6.4
Assets
Revenue
Net income ($mil.) % chg. 1,236 -20.7 1,285 -47.1 1,172 -16.4 69 -9.9 52 -2.9 34 7.0 5 -95.9 44 -9.7 602 21.1 3,201 -1.9 2,273 -30.6 4 -12.0 9,978 -21.8
Net income
EPS ($)2
Cash flow4
ROE (%)5 2019 2020 14.6 10.2 13.9 10.9 15.7 11.3 11.0 9.7 14.7 13.6 7.3 8.9 12.8 6.3 7.7 5.2 16.9 16.3 17.1 14.3 15.8 11.5 9.0 8.3 15.4 11.9
ROE (%)5 2019 2020 12.6 1.1 N/A N/A N/A 10.8 32.7 36.5 12.1 7.3 7.7 6.6 0.5 10.4
ROE (%)5 2019 2020 3.6 3.1 13.8 12.5 12.5 10.2 13.4 8.1 11.4 11.2 13.0 9.9
ROE (%)5 2019 2020 5.9 4.5 N/A 0.1 6.8 N/A 16.9 11.0 10.2 10.7 10.0 4.3
ROE (%)5 2019 2020 5.6 5.3 11.4 2.6 35.3 35.1 0.5 3.9 7.4 N/A 17.5 16.8 4.7 6.0 NA NA 11.7 5.7
Assets ($bil.) % chg.
Revenue
EPS ($)2
CF/share2
0.4 -12.2 1.9 17.5 16.9 -5.0 39.0 4.9 2.2 5.5
($mil.)
11.3 61.2 225.5 166.6 15.0 22.3 501.9
% chg. ($mil.)
-19.4 5.1 -1.3 1.7 -9.6 85.9 10.9 50.8 -2.3 7.8 -11.8 11.7 -2.8 163.1
% chg.
120.2 -82.9 5.0 15.1 -12.3 -13.6 1.5
2019
0.28 0.03 0.16 0.72 0.37 0.16
2020
0.55 0.00 0.17 0.84 0.34 0.14
2019
-1.26 0.19 0.73 -2.84 0.16 0.35
2020
7.02 -0.54 2.03 7.45 2.80 0.24
1.8
-28.6 Assets
Assets ($bil.) % chg.
7.7 10.1
0.1 0.0 70.6 0.0 33.2 12.2
Revenue
EPS ($)2
Cash flow4
% chg.
-7.5 2.7 -17.7 4.4 8.9 5.2
($mil.)
1,681 19,710 6,684
27,486 15,186 70,747
% chg.
162.2 617.8 63.9 23.7 49.7 77.6
($mil.)
544 946 193 839 666
% chg. 2019
1,073.8 8.81 35.3 0.70 3.2 1.69 -44.7 0.73 -1.3 1.02
2020
103.67 0.93 1.69 0.35 0.91
2019
17.09 2.87 3.12 2.71 3.09
2020
9.49 1.48 -5.14 2.04 -0.22
6.9 0.4
Assets ($bil.)
($mil.)
89.0 12,849.0 475.4 166.9 50.1 775.5 31.0 2.2 14,439.2
% chg. ($mil.)
-18.9 5.3 -24.1 -1,493.0 -10.4 119.8
11.3 4.1 9.1 51.2 -3.5 183.5 89.6 10.5 -13.8 0.0 -22.3 -1,118.6
% chg.
-53.6 N/A -13.3 412.5 191.1 -4.9 563.6 N/A N/A
2019
0.14 0.24 0.58 0.00 0.62 0.81 0.06 0.00
2020
0.07 -0.43 0.55 0.04 1.87 0.77 0.41 0.00
2019
0.33 0.31 0.64 0.42 0.68 1.08 0.33 0.01
2020
0.33 1.63 0.96 0.51 0.89 0.98 0.38 0.02
Revenue
Cash flow4
CF/share2 2019 2020
1.97 2.30
Cash flow4 ($mil.) % chg. 21,049.0 4,899.8 -1.8 N/A 1,730.0 -42.9 22,777.2 561.2
ROE (%)5 2019 2020
7.3 7.1
CF/share2 2019 2020
NC NC -0.04 0.00 4.11 1.96
($mil.) 217.7
% chg. 3.5
EPS ($)2
2019 2020 ($mil.)
1.36 1.35 130.9
% chg. 17.4
($bil.)
% chg.
12.6 -22.3 3.7
($mil.)
6,616.0 6.7 20,446.0 27,068.7
% chg.
25.3 -8.1 482.3 207.6
($mil.)
529.0 48.9 1,105.0 1,682.9
% chg.
-23.6 N/A 32.7 11.0
Assets
Net income
EPS ($)2 2019 2020
NC NC -0.12 0.49 0.84 1.02
ROE (%)5 2019 2020 8.0 7.6 N/A N/A 12.2 11.4 9.4 8.7
349.9 0.6 479.0
3.8 % chg.
-0.5 Revenue
EPS ($)2
CF/share2
1.7
Revenue
Net income
EPS ($)2
CF/share2
Net income ($mil.) % chg. 29.5 15.2 -2.2 N/A 17.6 42.6 44.9 30.8
Net income ($mil.) % chg. 76.9 0.3
Revenue
EPS ($)2
Cash flow4
ROE (%)5 2020
Efficiency ratio (%)3
2019 2020
58.3 55.0 53.2 49.8 56.5 55.9 46.5 47.0 39.5 39.2 55.4 50.5 60.4 58.6 72.9 70.4 52.3 50.2 55.9 55.9 54.5 53.3 48.6 48.6
55.4 53.8
Cash flow4 ($mil.) % chg. 60.5 N/A -129.6 N/A 902.3 164.3 447.3 N/A 68.4 1,645.5 19.6 -34.2 1,368.5 222.6
Cash flow4 ($mil.) % chg. 133 69.7 1,458 -46.8 -538 N/A 4,117 -23.9 3,056 60.8 8,226 -21.4
Combined ratio8 2019 2020 95.4 104 100.9 94.9 96.8 100.4 97.0 89.5 35.2 45.4
Cash flow4 ($mil.) % chg. 25.8 -2.8 1,616.0 101.2 208.7 36.9 52.4 24.7 24.8 28.8 232.4 -9.6 9.8 16.3 0.3 48.0 2,170.3 65.8
CF/share2
2019 2020 2019
-1.28 -1.34 11.9 -0.23 -0.67 N/A -3.85 17.15 6.7
7.0
