
Page 5 - Newcom
P. 5
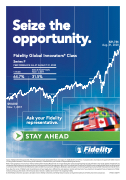
                                                                                                                                                                                                         Seize the opportunity.
$21,724
Aug. 31, 2020
      Fidelity Global Innovators® Class Series F
PERFORMANCE AS AT AUGUST 31, 2020 SINCE INCEPTION
     1 YEAR 64.7%
$10,000
Nov. 1, 2017
NOV. 1, 2017 31.5%
2019
                2017
2018
                   Ask your Fidelity representative.
STAY AHEAD
                               Source: Fidelity Investments Canada ULC. Performance shows annual compounded returns as at August 31, 2020 (Series F) net-of-fees, in Canadian dollars. Chart depicts the growth of $10,000 invested in Fidelity Global Innovators® Class over the period indicated, in Canadian dollars, and is based on compounded daily total returns.
Read a fund’s prospectus and consult your financial advisor before investing. Mutual funds are not guaranteed; their values change frequently and past performance may not be repeated. Investors will pay management fees and expenses, may pay commissions or trailing commissions and may experience a gain or loss. The indicated rates of return are the historical annual compounded total returns including changes in unit value and the reinvestment of all distributions and do not take into account sales, redemption, distribution, optional charges or income taxes payable by any security holder that would have reduced returns.
If you buy other series of Fidelity funds, the performance will vary largely due to different fees and expenses. Investors who buy Series F pay investment management fees and expenses to Fidelity. Investors will also pay their dealer a fee for financial advice services in addition to the Series F fees charged by Fidelity.
© 2020 Fidelity Investments Canada ULC. All rights reserved. Fidelity Investments and Fidelity Global Innovators are registered trademarks of Fidelity Investments Canada ULC. 391823-v202097
ADV 391545 TRADE_Seize the opportunity GIC-mtn chart IE Sept 21_v2.indd 1 2020-09-08 4:38 PM
