
Page 12 - Newcom
P. 12
12 | INVESTMENT EXECUTIVE BROKERAGE REPORT CARD October 2020 Characteristics
of ETF users
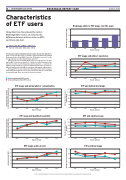
Using data from Investment Executive’s Brokerage Report Card, we looked at the differences between advisors who use ETFs and those who don’t
n ANALYSIS BY JAMES LANGTON, KATIE KEIR AND MELISSA SHIN
etf usage among brokerage advisors has risen dramat-
ically over the past five years, according to Investment Executive’s annual Brokerage Report Card (BRC). However, ETFs didn’t crack 10% of the average advisor’s product distribution until 2020.
Advisors who reported using ETFs (any percentage above zero) dur- ing the BRC’s 2020 research period — January to early February, before the effects of the Covid-19 pandemic hit the markets — tended to be slightly younger and less experienced than advisors who reported 0%, but the former group had higher book values and annual compensation.
During all five years analyzed, ETFs apparently did not replace mutual funds in advisors’ books, but rather allocations to individual stocks and bonds. Have a look at the charts for details.
n Survey participants with ETFs in book
n Survey participants without ETFs in book
Brokerage advisors’ ETF usage over the years
30% 25% 20% 15% 10%
5% 0%
50% 40% 30% 20% 10%
0%
250 200 150 100 50 0
2016
2017
2018
2019
2020
15% 10% 5% 0%
25 24 23 22 21 20 19
2016
2017 2018
Report Card year
2019 2020
ETF usage and annual advisor compensation
18 2016
30% 25% 20% 15% 10%
5%
0% 2016
60% 50% 40% 30% 20% 10%
0% 2016
20% 15% 10%
5%
0% 2016
ETF usage and advisor experience
2017 2018 2019 2020
Report Card year
ETF and mutual fund usage
2017 2018 2019 2020
Report Card year
ETF and equities usage
2017 2018 2019 2020
Report Card year ETF and bond usage
2017 2018 2019 2020
Report Card year
Report Card year
ETF usage and wealthy households
2016
2017
2018
2019
2020
Report Card year
ETF usage and book size
2016
2017
2018
Report Card year
2019
2020
Source: Investment Executive. For gross revenue by product, survey participants were asked about 10 categories in total.
Households with at least $1 million Average book value ($mil.) in AUM in average participant’s book
Survey participants who made
at least $1 million in the previous year
Average % of gross revenue Average % of gross revenue in bonds in equities
Average % of gross revenue
in mutual funds Average years in the industry Average % of gross revenue in ETFs
