
Page 10 - Newcom
P. 10
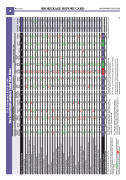
May 2020 BROKERAGE REPORT CARD INVESTMENT EXECUTIVE 10
Number of advisors surveyed per firm
39
50 50
50
50
32
30 30
52
51 50
50
50 50
Firm's total compensation
Firm's reward/recognition program
Firm's support for advisors operating within a fee-based model Technology tools & advisor desktop
Support for mobile technology & the mobile advisor
Support for using social media
Back office & administrative support
Firm's marketing support for advisor's practice
Client account statements
Online account access for clients
Ongoing training
Your branch manager
Firm's succession program for advisors
Products & support for high net-worth clients
Support for developing a financial plan for clients
Support for developing an investment plan for clients*
Support for wills and estate planning
Support for tax planning
Support for insurance planning
Support for discretionary portfolio management
Quality of firm's product offering
Firm's stability
Firm's strategic focus
Firm's effectiveness in keeping advisors informed
Firm's receptiveness to advisor feedback
Firm's corporate culture
Firm's reputation with clients and/or prospective clients
Firm's ethics
Support for helping to deal with changes in the regulatory environment Advisor's relationship with compliance department
Freedom to make objective product choices
Firm's delivery on promises
IE Rating (Average of all categories)
Net Promoter Score (Range: -100 to 100)
8.9 8.1 9.0 8.4 8.9 8.3 8.4 8.3 8.0 8.6 8.4 8.4 6.8 8.4 9.0
9.4 8.2 9.4 5.3 8.9 6.9 9.4 5.5 8.7 6.3 8.0 5.8 8.6 6.6 7.8 5.3 8.9 6.9 8.8 7.0 9.6 5.7 N/A 7.5 9.5 5.9 8.0 5.6 9.5 4.8
8.7 7.6 8.5 7.6 8.4 8.2 8.3 7.0 7.8 8.0 7.7 8.8 8.1 7.9 8.4
8.5 N/A 9.0 8.3 8.8 7.5 8.7 7.9 7.7 8.7 7.9 8.7 8.7 9.0 8.7
9.6 9.3 9.7 9.3 9.8 9.6 8.9 9.3 9.0 9.5 9.3 9.5 9.3 9.6 9.8
9.2 9.2 7.9 8.3 9.2 9.0
7.2 5.9 7.0 5.6 6.4 6.1 5.6 5.1 7.4
8.2 8.2 8.0 7.2 8.4 8.7
9.1 8.7 9.2 8.6 8.9
9.1 7.7 9.1 6.9 8.8 7.6 7.2 6.5 8.2 7.3 8.0 5.9 8.1 6.7 7.6 7.6 7.7 7.2 8.2 8.7 8.8 7.2 9.4 8.1 8.3 7.7 8.4 7.8 9.1 7.3
8.7 9.1 7.8 7.0 8.6 9.1 7.7 9.2 8.2 8.7 7.4 7.0 8.0 9.3 7.5 8.1 7.8 8.7 8.3 8.9 7.9 8.0 8.7 8.7 8.0 8.8 8.2 9.1 8.3 9.1
All ratings are based on a scale of 0 to 10.
The “performance average” tallies all the ratings in a given category and averages them together. You can check to see if a company is above or below the average.
*Companies were only rated in this category if most advisors indicated that investment planning was separate from financial planning.
Source: Investment Executive research
N/A means a category does not apply to a company; N/C means the category is not calculable as not enough advisors rated it to be a reasonable sample.
The “importance average” tallies all the importance ratings in
a given category and averages them together. It is intended to measure how important advisors think a Report Card category is to their business.
The “IE rating” is an average of all of a company’s category ratings. The Net Promoter Score ranges from -100 to 100. A score over 0
Numbers in GREEN indicate a rating has increased by at least 0.5 of a point from last year. Numbers in RED indicate a rating has decreased by at least 0.5 of a point from last year.
is considered good, over 50 is considered excellent and over 70 is considered exceptional.
IE
Canaccord Genuity Wealth Mgmt
Industrial Edward Alliance
Raymond James
Richardson Wealth
Wellington- Altus Private Wealth
Leede
Jones Odlum Gable Brown
BMO Private Wealth
CIBC National Wood Bank
Scotia- TD Wealth McLeod PIA
Performance Importance average average
8.4 8.0 8.7 9.1 9.4 9.2 8.9 8.8 8.5 8.8 8.0 8.8 9.3 9.3 9.8 8.7 8.6 74.4
7.7 N/A 7.3 N/A 8.9 6.9 N/A N/C 9.4 8.3 9.8 8.0 9.8 6.3 9.5 6.6 9.0 6.6 9.6 6.4 9.2 6.6 9.8 8.5 9.8 7.8 9.5 7.8 9.3 9.2 9.6 6.7 9.1 6.8 86.0 14.0
7.7 8.4 8.1 8.4 8.5 9.6 8.7 8.0 8.7 8.8 8.6 9.6 8.3 9.0 9.7 8.7 8.4 74.0
8.9 8.9 8.7 8.9
9.3 9.5 9.4 9.7 9.8 9.9 9.9 9.7 9.9 9.8 9.6 9.9 9.7 9.7 9.9 9.8 9.6
7.9 7.5 7.9 8.0 8.1 5.4 5.4 5.7 4.4 5.4 7.9 8.7 7.6 8.4 8.8 7.2 6.9 -34.6
9.0 8.7 8.1 7.2 9.0 8.2 8.7 6.6 8.9 8.3 9.0 9.3 8.9 7.5 8.9 7.8 9.3 6.3 9.3 7.6 9.2 9.2 9.7 9.1 9.0 8.3 9.2 8.7 9.9 9.5 8.8 6.3 8.7 7.7 73.5 28.0
8.4 8.7 8.1 8.7 8.4 8.4 8.5 9.1 8.9 9.1 9.0 9.5 8.4 9.0 8.4 8.8 8.2 9.0 8.5 9.0 8.7 9.2 9.4 9.7 8.9 9.1 9.1 9.2 9.6 9.8 8.6 9.4
2020 BROKERAGE REPORT CARD
How investment advisors rated their firms
Jones Securities
Gundy Financial
RBC DS
NATIONAL INDEPENDENTS
REGIONAL INDEPENDENTS
BANK-OWNED INVESTMENT FIRMS
8.4 8.8 8.4 8.8 8.9 8.9 8.6 9.5 8.9 9.1 9.8 8.5 8.7 74.0
100.0
8.9 7.7 9.6 8.3 8.0 6.4
7.2 7.9
9.6 9.1 7.7 8.8 8.5 7.8 8.1 7.7 8.2 8.5 9.0 8.5 N/C 7.6 8.4 8.4 N/C 9.0 N/C N/A N/A 8.1 N/A 8.7 N/C 8.4 N/C 8.6 9.1 9.6 9.8 9.9 9.3 8.9 9.0 9.0 9.5 8.4 9.3 9.2 8.9 9.7 9.7 9.7 9.5 9.1 9.7 9.5 9.9 9.8 9.5 9.5 9.0 8.7 96.7 93.3
7.0 8.6 7.3 6.6 7.4 7.0
8.3 8.3 8.6 7.7 8.5 9.0 9.1 N/C 9.5 9.5 8.8 9.3 9.2 9.2 N/C 9.7 9.9 9.6 9.4 8.6 9.3 9.7 9.8 9.5 9.5 9.7 9.3 9.1 92.0
7.1 5.6 8.3 6.8 7.4 7.8
7.0 7.3 7.3 7.4 8.6 8.0 7.5 7.6 8.9 8.2 8.7 8.3 8.2 8.0 8.6 7.0 7.1 8.2 7.5 8.2 6.8 8.5 7.5 8.2 8.8 8.9 8.4 8.6 9.2 8.0 8.1 8.3 7.9 8.2 8.0 8.1 8.3 8.4 7.9 9.4 9.1 8.5 8.7 9.0 9.2 9.8 9.5 9.0 8.1 8.3 8.0 56.9 48.0
7.4 8.5
