
Page 11 - Newcom
P. 11
April 2020 NEWS Seg funds positioned
to ride out the storm
INVESTMENT EXECUTIVE | 11
Manulife takes an “all weather” approach, aiming for performance over full market cycles
performance in 2019 didn’t overload on momentum stocks; instead, they continued to focus on high-quality equities.
The seg fund family of
Manufacturers Life Insurance Co. (a.k.a. Manulife) led in 2019, with 86.2% of long-term assets under management (AUM) in funds ranked first or second quar- tile by Morningstar Canada for the year ended Dec. 31, 2019. This mirrored the Manulife mutual fund family’s performance of 89.3%. That’s not surprising, as most seg funds are mutual funds with an insurance wrapper. (All companies are based in Toronto
unless otherwise noted.) Manulife’s fund portfolio man-
agers take a bottom-up stock-pick- ing approach, focusing on quality. Brent Wilson, director, invest- ment research and analysis, with Manulife’s investment-manage- ment services team, says this approach will serve the team well this year despite Covid-19. “We try to not let short-term expectations affect stock selection,” Wilson says. “The approach is an all- weather one, aiming for good per- formance over full market cycles.”
The combined seg fund family of RBC Life Insurance Co. and RBC Global Asset Management (RBCGAM), subsidiaries of Royal Bank of Canada, also did well, with 83.6% of AUM in above-aver- age performing funds. The family is small, with just $1.7 billion in AUM as of Dec. 31.
At $35.1 billion in AUM, Manulife’s seg fund family is the second-largest, behind London, Ont.-based London Life Insurance Co.’s $38.1 billion. The only other big family is that of Quebec City-based Industrial Alliance Insurance and Financial Services Inc. (IA), at $24.1 billion.
London Life had relatively weak performance, with 35.2% of AUM in above-average performing funds. London Life is owned by Winnipeg-based Great West Lifeco Inc., which also owns Great-West Life Assurance Co. (GWL) and Canada Life Assurance Co., both of which also have seg fund fam- ilies, with AUM of $8.2 billion and $8.4 billion, respectively. Great- West Life’s seg fund family did best among the parent company’s insurance subsidiaries, at 39.9% of AUM in above-average funds, while Canada Life’s was the weak- est at 31.7%.
(As of Jan. 1, 2020, these three insurance companies became one under the Canada Life name. All three have used the same investment-management team for quite some time.)
IA’s seg fund family fared a little better than the three GWL families, with 44.6% of its $24.1 billion of AUM in above-average performing funds.
Other fund families that had more than 50% of their AUM in above-average performing funds were those of Sun Life Insurance Co. and Sun Life Global Investments (Canada) Inc. (62.5%, combined); Regina-based Co-operators Life Insurance Co.
(58.9%); Waterloo, Ont.-based
Equitable Life Insurance Co. of Canada (53.3%); and Kingston, Ont.-based Empire Life Insurance Co. (51.9%).
The weakest performer was Mississauga, Ont-based Primerica Life Insurance Co. (10.0%). These funds missed much of the surge in equities because of their heavy weight- ing in fixed-income. The com- pany uses strip bonds rather than traditional insurance con- tracts to meet maturity guaran- tees and usually lags when stocks are doing well.
Here’s a look at some of the seg fund families in more detail: ■■ manulife. Wilson notes that 2019 was “more difficult for most of our [portfolio] managers because their focus is on quality and reasonable valuations rather than momentum.” Nevertheless, the funds did well. The port- folio managers avoided canna- bis stocks. Winners included Constellation Software Inc. and Brookfield Asset Management Inc. (BAM). BAM’s stock price has dropped along with the market due to the coronavirus, but the shares of Constellation, given it’s a tech company, have not fallen by as much.
Third-party portfolio man- agers that manage some of Manulife’s funds also did well. This was particularly the case for funds managed by Calgary-based Mawer Investment Management Ltd. and Montreal-based National Bank Securities Inc.
■■ rbc life/rbcgam. This small seg fund family benefits from the investment team at RBCGAM, which manages the underlying mutual funds. The large underlying mutual fund family had 69.3% of long-term assets in first or second quar- tile-ranked funds during each of the past six years.
■■ co-operators life. Says Lucilla Nardi, Co-operators’ assistant vice president for wealth and estate planning sales development: “There were double-digit returns for most funds, so both clients and advis- ors were happy.”
With the coronavirus-related drop in markets, Nardi adds, “we’re telling clients that it’s best to stay invested so as not to lose the protection provided
> TURN TO QUALITY / PAGE 12
BY CATHERINE HARRIS
with stock markets in
free fall due to Covid-19, invest- ment performance for segre- gated funds in 2019 may seem irrelevant. It isn’t. It’s important to understand how seg fund fam- ilies handled last year’s invest- ment environment and how they are positioned for 2020 to help you and your clients make deci- sions about where to invest.
Last year was a momentum year in which stocks recovered from the 20% plunge at the end of 2018 and then climbed further as recession risks receded with the U.S. Federal Reserve Board
cutting interest rates three times. But the gains were concen- trated in well-known growth stocks such as the U.S.-based FAANGs — Facebook Inc., Amazon.com Inc., Apple Inc., Netflix Inc. and Alphabet Inc.
(Google LLC’s parent).
Despite this, seg fund fam-
ilies that had the best investment
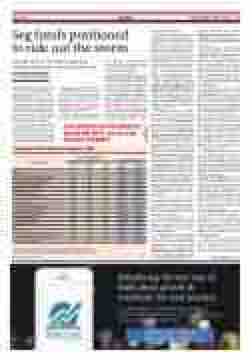
Segregated fund family performance, 2019
Seg fund family
It was difficult to beat stock indexes last year, but 2020 will be a year for active investment management
Assets in 1st and 2nd quartile for years ended Dec. 31
Long-term assets1
Y/E ‘19 (%)
Y/E ‘18 (%)
Y/E ‘17 (%)
Y/E ‘19 ($mil.)
Y/E ‘18 ($mil.)
Manulife
86.2
50.5
70.3
35,049.6
31,430.3
RBC Life Ins./RBC Global Asset Mgmt.
Sun Life Ins./Sun Life Global Inv.
83.6
62.5
46.7
74.9
89.4
81.2
1,714.2
3,044.7
1,313.2
2,151.3
Co-operators Life Insurance
58.9
48.1
73.7
2,141.4
1,782.9
Equitable Life Insurance
53.3
34.8
35.1
1,310.2
1,101.5
Empire Life Insurance
51.9
30.0
58.4
10,884.6
9,825.9
Desjardins Financial Security
49.2
60.8
33.5
3,750.5
3,666.9
CI Investments
45.5
37.3
33.6
8,570.2
8,683.5
Industrial Alliance Management
44.6
40.2
60.1
24,082.8
20,775.7
Great-West Life Assurance
39.9
69.6
58.0
8,189.0
7,945.1
SSQ-Societe d’assurance vie
38.1
31.4
45.4
3,472.4
3,377.9
London Life Insurance
35.2
65.6
42.1
38,095.7
34,630.1
Canada Life Assurance
31.7
55.3
47.0
8,439.4
7,338.8
Ivari
31.5
34.4
18.6
824.9
864.9
Investors Group
29.1
60.4
44.0
1,593.4
1,603.4
La Capitale Insurance and Financial Serv.
28.0
81.1
54.0
2,176.1
1,575.2
Primerica Life Insurance
10.0
96.6
27.6
3,226.5
2,987.2
1. Excludes money-market funds. When only one asset figure is provided for funds with different versions, the assets are divided equally among the versions. There also can be some double-counting when stand-alone funds are included in funds of funds
Source: Morningstar Canada
IE
