
Page 8 - CU Jan 2020.pdf
P. 8
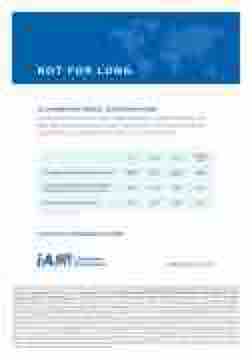
                                                                                                                                                                                                                                                                                                                                                                                                                                                                                                                                                                                                                                                                                                                                                                       NOT FOR LONG.
                                                                                             IA CLARINGTON GLOBAL ALLOCATION FUND
Loomis Sayles, one of the most respected firms in global investing, has been delivering exceptional results. Let clients in on the wealth-creation potential of IA CLARINGTON GLOBAL ALLOCATION FUND.
  1 Year
 2 Years
 3 Years
 Manager tenure1
 IA Clarington Global Allocation Fund – Series F
18.9%
9.6%
12.4%
8.6%
 60% MSCI AC World Index,2 40% FTSE World Government Bond Index (currency hedged)
 13.6%
 7.1%
 8.8%
 6.7%
 Peer group (Global Equity Balanced)
 11.6%
 4.5%
 6.4%
 4.7%
Source: Morningstar, as at January 31, 2020.
Learn more at iaclarington.com/GAF
Loomis Sayles is the trade name of Loomis, Sayles & Company, L.P. 1Effective February 23, 2015, the sub-advisor of the Fund changed from Aston Hill Asset Management Inc. to Loomis, Sayles & Company, L.P. and IA Clarington Investments Inc. Unless otherwise indicated, all data is as at January 31, 2020. IA Clarington Global Allocation Fund (Series F) 1 year: 18.9%, 2 years: 9.6%, 3 years: 12.4%, manager tenure: 8.6%, 5 years: 9.0%, since inception: 8.7%. 60% MSCI AC World Index, 40% FTSE World Government Bond Index (currency hedged) 1 year: 13.6%, 2 years: 7.1%, 3 years: 8.8%, manager tenure: 6.7%, 5 years: 7.0%, since inception: 9.2%. Peer group (Global Equity Balanced) 1 year: 11.6%, 2 years: 4.5%, 3 years: 6.4%, manager tenure: 4.7%, 5 years: 5.2%, since inception: 7.5%. The inception date of series F of the Fund was July 19, 2010. Manager tenure data from March 1, 2015. There are various important differences that may exist between the Fund and the stated indices that may affect the performance of each. The benchmark is a blend of FTSE World Government Bond Index (currency hedged) (40%) and MSCI AC World Index (60%). The FTSE World Government Bond Index (or WGBI) (currency hedged) measures the performance of fixed-rate, local currency, investment-grade sovereign bonds. The WGBI is a widely used benchmark that currently comprises sovereign debt from over 20 countries, denominated in a variety of currencies. The MSCI AC World Index (MSCI ACWI) is a free float-adjusted market capitalization weighted equity index comprising 23 developed and 23 emerging market country indexes. The Fund’s market capitalization, geographic, sector, credit quality and currency risk exposure may differ from that of the benchmark. The Fund may hold cash while the benchmark does not. Overall, the Fund’s bond and equity exposure can differ from the benchmark. It is not possible to invest directly in market indices. The performance comparison is for illustrative purposes only and does not imply future performance. The information provided herein does not constitute financial, tax or legal advice. Always consult with a qualified advisor prior to making any investment decision. Indicated mutual fund rates of return include changes in share or unit value and reinvestment of all dividends or distributions and do not take into account sales, redemption, distribution or optional charges or income taxes payable by any securityholder that would have reduced returns. Returns for time periods of more than one year are historical annual compounded total returns while returns for time periods of one year or less are cumulative figures and are not annualized. Commissions, trailing commissions, management fees, brokerage fees and expenses all may be associated with mutual fund investments, including investments in exchange-traded series of mutual funds. Please read the prospectus before investing. Mutual funds are not guaranteed, their values change frequently and past performance may not be repeated. 2MSCI makes no express or implied warranties or representations and shall have no liability whatsoever with respect to any MSCI data contained herein. The MSCI data may not be further redistributed or used as a basis for other indices or any securities or financial products. This report is not approved, reviewed, or produced by MSCI. The iA Clarington Funds are managed by IA Clarington Investments Inc. iA Clarington and the iA Clarington logo are trademarks of Industrial Alliance Insurance and Financial Services Inc. and are used under license.
