
Page 20 - Newcom
P. 20
investments
The precariousness of low interest rates Part 2
of return (r*) were discussed in Part 1. However, the most significant reason to
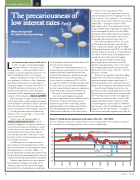
own bonds has been the hedging effect rela- tive to stocks. The covariance — the measure of the directional relationship between stocks and bonds — was positive before 1997
and negative after. The capital asset pricing model (CAPM) beta of bond prices relative to stocks averaged 0.2 before the late 1990s, indicating stocks and bonds moved together, but bonds were less volatile, thus offering reasonable diversification (see Chart 1).
After 1997, average beta fell to -0.2, and stocks and bonds moved in opposite direc- tions. A practical example: during the 2008- 2009 global financial crisis (GFC), the S&P 500 fell 37% while the 30-year U.S. Treasury bond rose 38%. A 50% stock, 50% bond portfolio would have been flat: perfectly hedged.
Although stock market volatility has been largely below trend since the GFC, portfolio managers have come to rely upon this hedging characteristic of government bonds as a tool of value. After all, it can’t be because of yields.
But there’s no guarantee that this hedging characteristic will continue, and the risk of being wrong has increased significantly. If 30-year Treasuries return to pre-GFC levels of about 4.5%, bond prices could fall by one-third.
Nevertheless, holding fixed income in a portfolio will likely always dampen both volatil- ity and return: the traditional investment trade- off. This may require a total return approach
to portfolio construction that’s closer to 80% equities and 20% bonds. Exposure to high- er-returning asset classes can be combined with a way to smooth withdrawals — a spend- ing policy like the Yale formula — to address low interest rates and negative real yields. AE
Why own bonds?
It’s about the sign change
by Mark Yamada
Low interest rates may be with us for
a while. Despite central bank pledges
to bolster inflation — at least to a 2% average range — conjuring inflation from a tentative economy waiting for a vaccine is a skill central bankers have yet to acquire.
Massive spending in the face of Covid-19
is no guarantee of inflation, either. Expanding government debt relative to output has not worked for Japan, which now owes 237% of 2019 GDP but whose inflation sits at 0.3%. Modern monetary theory offers alternative views about deficit spending and inflation but remains controversial (see Advisor.ca/MMT ).
Bond investors will have to take more risk if they want higher yields, and pension plans will need higher contribution rates to fund the same future benefits. Retirees may have to learn to do with less. With negative real rates — 10-year government bond yields below inflation of 2%, for example — why would anyone own a bond?
of Canada have indicated flexibility above 2% for future policy targeting.
For legions of retiring baby boomers, low interest rates are a real cause for concern. The old-fashioned way of drawing income from retirement savings was to spend interest and dividends and never touch the principal. In recent years this would mean 2.5% to 3.5% per year from a 50% stock–50% bond portfolio — a little short of the storied 4% withdrawal rate that was estimated to preserve capital and ensure that funds would not be exhausted.
But what if interest rates go negative?
Low returns and negative real yields
have been explained by lower inflation expect- ations from tempered demand, reduced productivity gains from technology, and an aging population with a higher propensity to save demanding bonds. Reduced inflation volatility and a reduction of the risk-free rate
In Part 1 (see AE February 2020, or Advisor.ca/precariousness1 ), written
before the pandemic, we observed that low current interest rates are primarily the result of three factors: low expected inflation, low expected short-term rates and a reduced term-risk premium (the extra return to com- pensate investors for being exposed to infla- tion volatility over time).
Chart 1: Stock-bond covariance and beta in the U.S., 1971-2019
10-year Treasury returns are constructed from zero-coupon yields. The covariance and beta are estimated from a rolling window of three months of daily data.
1.5 1.0 0.5
0 -0.5 -1.0 -1.5 -2.0 -2.5
Source: Bloomberg Finance LP; Federal Reserve Bank of New York; Campbell, Sunderam, Viceira.
Contributing to these tempered expect- ations has been the anticipation that central banks will intervene to blunt inflation by raising rates aggressively — as in the 1980s — or provide liquidity by lowering rates and injecting funds into the system via quantitative easing to avoid crisis-induced capital market constipation.
Inflation expectations have been guided by the Bank of Canada’s 2% target since 1991 but, until recently, only as the upper bound. Both the Federal Reserve and Bank
20
FALL 2020
CAPM bond beta
Sign
change
Covariance
1970 1975 1980 1985 1990 1995 2000 2005 2010 2015 2020
ISTOCK.COM / CONCEPTUALMOTION
