
Page 11 - Newcom
P. 11
line represents the “lucky” outcome (the top decile, or top 10%, of all outcomes). A lucky outcome can happen when the recovery is described as V-shaped. The red line represents the bottom decile or “unlucky” outcome. An unlucky outcome usually means a multi-year bear market (such as 1929 or 2000) with several aftershocks.
Figure 1: Accumulation portfolio—Keith’s aftcast
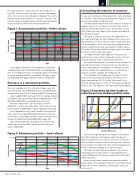
Forecasting the majority of scenarios
In case your clients ask similar questions, I ran a multitude of scenarios. The results are summarized in Figure 3. Let’s work on an example using that chart.
Jeff has a balanced portfolio of $1 million. He does not add any money to it, nor does he need income from it. After an unfortunate market event, his portfolio is down 22%. When can Jeff expect to see his portfolio back at the $1-million mark?
On Figure 3, draw a vertical line (the dashed line on the chart) starting at the 22% initial portfolio loss on the horizontal axis. Continue this line until it reaches the grey 0% accumulation curve. From this point, draw a horizon- tal line toward the left axis, and read the number: about 4.2 years. This is historically how long it took the median portfolio to reach its pre-loss value.
Jeff might wonder what happens if he gets lucky and the loss comes with a V-shaped recovery, or if he’s unlucky and gets stuck in a multi-year downturn.
For an accurate answer, you need to run an aftcast for each specific scenario. However, here’s a rule that cov- ers the vast majority of situations: to estimate the lucky outcome, divide the median by three; to estimate the unlucky outcome, multiply the median by 2.5.
In our example, the median was 4.2 years. If Jeff is lucky, he will see his portfolio back to $1 million in 1.4 years (calculated as 4.2 / 3). On the other hand, if he’s unlucky, that day may not come for 10.5 years (calculated as 4.2 x 2.5). This assumes Jeff stays invested throughout.
Figure 3: Estimating the time it takes to reach the pre-loss median portfolio value
20
15
10
5
0
0 20 40 60 80
Initial portfolio loss
Your client might ask about the impact of their asset mix. When fractal events happen, asset mix doesn’t make much difference on the recovery time. If the port- folio is heavy in equities, then it loses more but can also recover faster. The main risk is the client’s staying power, which is easier to manage in a V-type recovery.
We’ll discuss asset allocation based on the client’s staying power in a future article. In my analysis here, I used a 40/60 asset mix for decumulation portfolios and 70/30 otherwise.
Keep in mind, these numbers are based on market history and on the assumption that the current borrowing binge can continue indefinitely. Meanwhile, enjoy this recovery. AE
$200,000 $150,000
$100,000
$50,000 $0
Lucky: 1.2 years
Median: 2.8 years
30 31 32 33 34 35 36 37 38
Age
It took about 2.8 years for the median line to reach the original portfolio value of $100,000 (the horizontal dashed line). In a V-shaped recovery, it would take about 14 months; in a multi-year bear market, it would take 5.8 years to see the $100,000 mark again, thanks to Keith’s contributions.
Recovery in a retirement portfolio
Our next example is for the retirement stage. Jane, 65, just retired. She has an RRSP portfolio worth $500,000, with an asset mix of 40% equities and 60% fixed income.
Jane needs $15,000 each year from her savings, indexed for inflation. This represents an initial withdrawal rate of 3% ($15,000 / $500,000), a sustainable amount for life.
After the fractal event, Jane’s portfolio is worth $425,000 — a 15% loss. Jane asks: “When will I see my portfolio back at $500,000?” Figure 2 displays the aftcast.
In a V-shaped recovery, Jane would see her portfolio value reach the original $500,000 after about 1.8 years (22 months). The median portfolio comes close but never reaches the $500,000 mark ($490,000 at age 75).
Jane will likely still have lifelong income. However, the chances are more than 50% that her portfolio will never return to $500,000.
Figure 2: Retirement portfolio—Jane’s aftcast
Accumulation 0%
Decumulation 1%
Decumulation 3%
Decumulation 3% (RRIF)
Accumulation 4%
Accumulation 10%
$1 million
Lucky: 1.8 years
$500,000
Median
Unlucky
Portfolio value
Portfolio value
Years to reach pre-loss median portfolio value
$0
65 70 75 80 85 90 95
Age
Unlucky: 5.8 years
ADVISOR.CA 11
investments
