
Page 26 - Newcom
P. 26
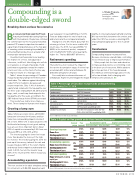
investments Compounding is a double-edged sword Breaking down various fee scenarios by Mark Yamada, president of PUR Investing Inc., a software development firm slightly. A conservative balanced fund returning 6% is a more likely investment for a retiree, and under the 2.5% fee scenario, a stunning 62% of accumulated capital goes to fees in just 25 years. Conclusions Compounding impacts returns and fees. Because returns are unpredictable, controlling fees is the best way to improve performance. Most people lack the time and education to make good decisions, so controlling costs is the best use of resources. While advisors get only a portion of the fees discussed, the infamous online brokerage ads correctly reflect an attitude that’s changing with enhanced fee disclosure. AE By now you’ve likely seen the TV ads featuring millennials discussing high fees with their advisors. People have criticized the commercials’ low-fee focus and noted that passive ETFs cannot outperform the market — a goal many mistakenly believe is the holy grail of investing, when increasing the probability of achieving financial objectives is actually what most people want and need. Investment professionals know beating the market net of fees, risk-adjusted or otherwise, is difficult. Identifying who will do so in advance is virtually impossible. Fund performances gravitate toward the market return over time, so the most effective way to improve results is to manage costs. Table 1 shows the percentage of Canadian mutual funds that underperform their bench- mark index. The odds are against identifying outperformers in advance because past returns mean little. Only 11.4% of domestic equity funds remained in the top quartile over the three years ending March 30, 2019, and no large-, mid-, or multi-cap funds stayed in the top quartile after five years, according to the S&P Indices Versus Active (SPIVA) scorecard. This is why fees matter more than you think. Three examples illustrate their impact. Growing a lump sum Table 2 shows a scenario where a $100,000 lump sum is invested for 40 years, and illus- trates how compounding impacts returns of 6% or 12%. While 12% is obviously better, the likelihood of achieving it is not good, making fees an even more important factor. About 60% of capital is consumed by 2.5% fees over 40 years (59% at 12%; 62% at 6%). The investor paying the lower fee keeps more than double the money of the high- fee investor. The investor paying the 2.5% fee puts up all the money, takes all the risk and keeps only about 40% of the return. Banks and mutual fund companies understand this math. A 0.5% fee lets the investor keep 83% of the return (at 6%). Which would you choose? Accumulating a pension The next section in the table simulates saving for retirement, with $6,000 deposited each year (equivalent to saving $500 per month). Fees are deducted at the end of each year, and returns and fees compound annually. Paying fees of 2.5% means about half the returns go to fees. For the more realistic 6% return case, the 0.5% fee leaves $864,714 (88%) in the investor’s pocket, compared with only $525,057 (53%) when paying the higher fee. That’s a $339,657 difference. Retirement spending The bottom section looks at the impact of fees at the decumulation stage. A retiree has accumulated $1 million and withdraws 4% ($40,000) annually for 25 years. Fees really bite in retirement because of withdrawals. Higher returns mitigate the impact Fund category Canadian equity Canadian small- and mid-cap equity Canadian dividend and income equity U.S. equity International equity Global equity Canadian-focused equity Comparison index S&P/TSX Composite S&P/TSX Completion S&P/TSX Canadian Dividend Aristocrats S&P 500 (CAD) S&P EPAC LargeMidCap (CAD) S&P Developed LargeMidCap (CAD) 50% S&P/TSX Composite + 25% S&P 500 (CAD) + 25% S&P EPAC LargeMidCap (CAD) Sources: S&P Dow Jones Indices LLC and Fundata Annual Fee return (annual) Accumulated capital Capital consumed by fees ($mil) (%) Before fees ($mil) After fees ($mil) 26 OCTOBER 2019 Source: PU˚ R Investing Inc. Note: taxes are not factored into these calculations. Table 1: Percentage of Canadian mutual funds underperforming Periods ending Dec. 31, 2018 1 year 5 year 10 year 76.9% 90.3% 91.0% 80.0% 80.5% 76.4% 65.2% 71.7% 100.0% 78.6% 96.0% 97.4% 55.6% 91.5% 95.2% 77.5% 95.1% 93.8% 83.1% 96.6% 95.1% Table 2: Capital and fee growth under three investing scenarios Growing a lump sum Flows: None Starting capital: $100,000 Time horizon: 40 years 6% 0.50% $1.03 $0.85 $0.18 17% 2.50% $1.03 $0.39 $0.63 62% 12% 0.50% $9.31 $7.78 $1.52 16% 2.50% $9.31 $3.77 $5.53 59% Accumulating a pension Flows: Deposit $6,000 per year Starting capital: $6,000 Time horizon: 40 years 6% 0.50% $0.98 $0.86 $0.12 12% 2.50% $0.98 $0.52 $0.46 47% 12% 0.50% $5.15 $4.46 $0.69 13% 2.50% $5.15 $2.54 $2.62 51% Retirement spending Flows: Withdraw 4% of starting capital / year Starting capital: $1 million Time horizon: 25 years 6% 0.50% $1.97 $1.65 $0.30 16% 2.50% $1.97 $0.75 $1.21 62% 12% 0.50% $11.03 $9.69 $1.33 12% 2.50% $11.03 $5.67 $5.35 49%
